
Physics
Double Award
Double Award
Cambridge IGCSE
These are practicals listed in the syllabus that you should be familiar with:
As stated clearly in the title here, you should be able to use basic measuring skills to record the motion (typically speed or acceleration) of simple objects.
An example of this would be to roll a toy car or ball down a very gentle long slope as shown in the diagram.
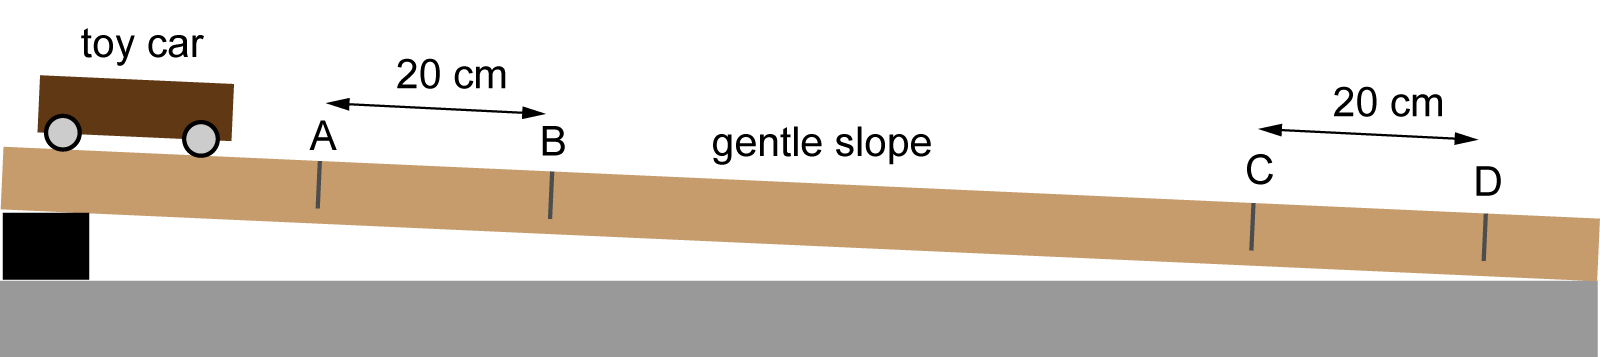
Some examples of experiments you could do are:
1. Finding the average speed:
Measure the distance from A to D, then time how long it takes the car to roll from A to D. Find the average speed by using the formula for speed shown above.
You could also find the speed over any of the shorter sections marked above, and compare as it rolls down the slope.
2. Finding the acceleration:
If we know the change in velocity (Δv) and time taken (t) we can use a = Δv /t
Note: Experiment 2 is much easier if we use light gates or similar technology to work out the velocity of the car for us.
You will need to know how to carry out a practical to find the density of an unknown substance. To do this, you will need to do the following:
| ρ = | m |
| V |
There are several standard ways to find the volume of a solid or liquid:
If the substance is a regular block with a rectangular cross section, then finding the volume is relatively easy:
For liquids, the volume can be found using a measuring cylinder. The volume of a liquid is typically measured in millilitres (ml), but a millilitre is the same volume as a cm3.
For irregular solids, for example a small stone, you will need a specialist piece of science apparatus called a eureka can, as shown in figure2:
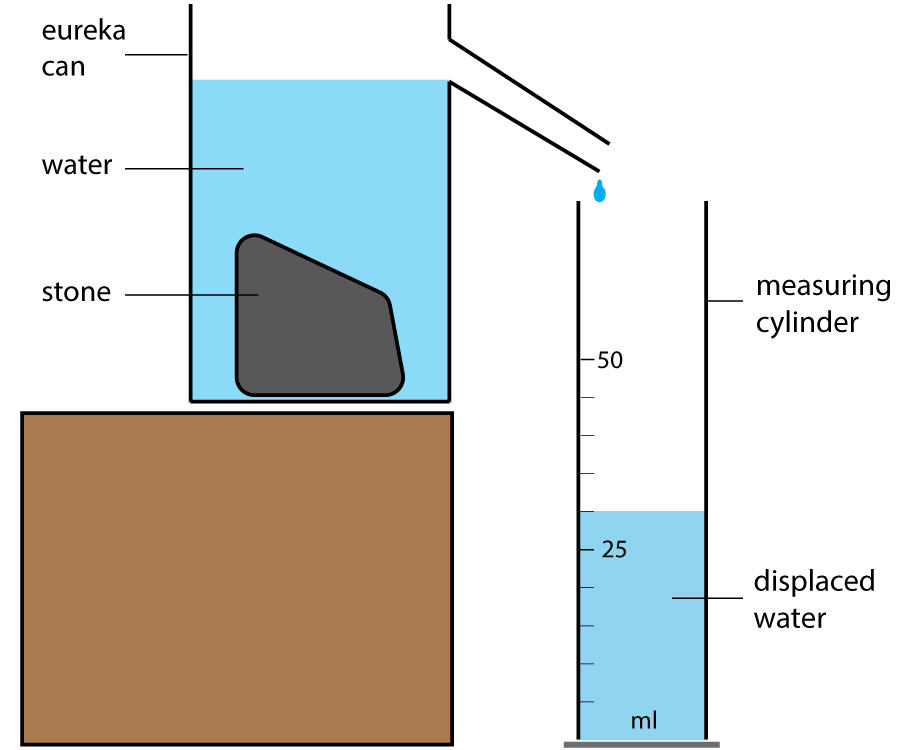
Figure 2. Using a eureka can to find the volume of a stone
The can is filled with water until it leaks out of the spout at the side. Once the leaking has stopped, put an empty measuring cylinder under the spout and then place the stone in the can. The stone will displace water - effectively pushing it out of the way, and this displaced water can be collected in the measuring cylinder. The volume of the water collected is the same as the volume of the stone.
This is a standard practical and is simple to do with some easily obtainable apparatus:
The video here shows how to carry out this simple practical:
YouTube: vt.physics
Robert Hooke was a scientist who first recorded the results he deduced for how things stretch. This basic principle, or 'law' on how cables and springs stretch is best understood by carrying out a practical investigation. In fact, this is a standard practical that you should know how to perform:
Method: [CC BY-SA 3.0 (https://creativecommons.org/licenses/by-sa/3.0)], via Wikimedia Commons")
Improvements:
This experiment is quite simple, but results can be improved by repeat readings, using a clamp on a ruler to ensure it does not move, attaching a light horizontal marker to the weights like a long pin (to make it easy to measure the extension), avoiding parallax etc.
Goggles are an essential safety feature here as the springs can damage your eyes if released quickly.
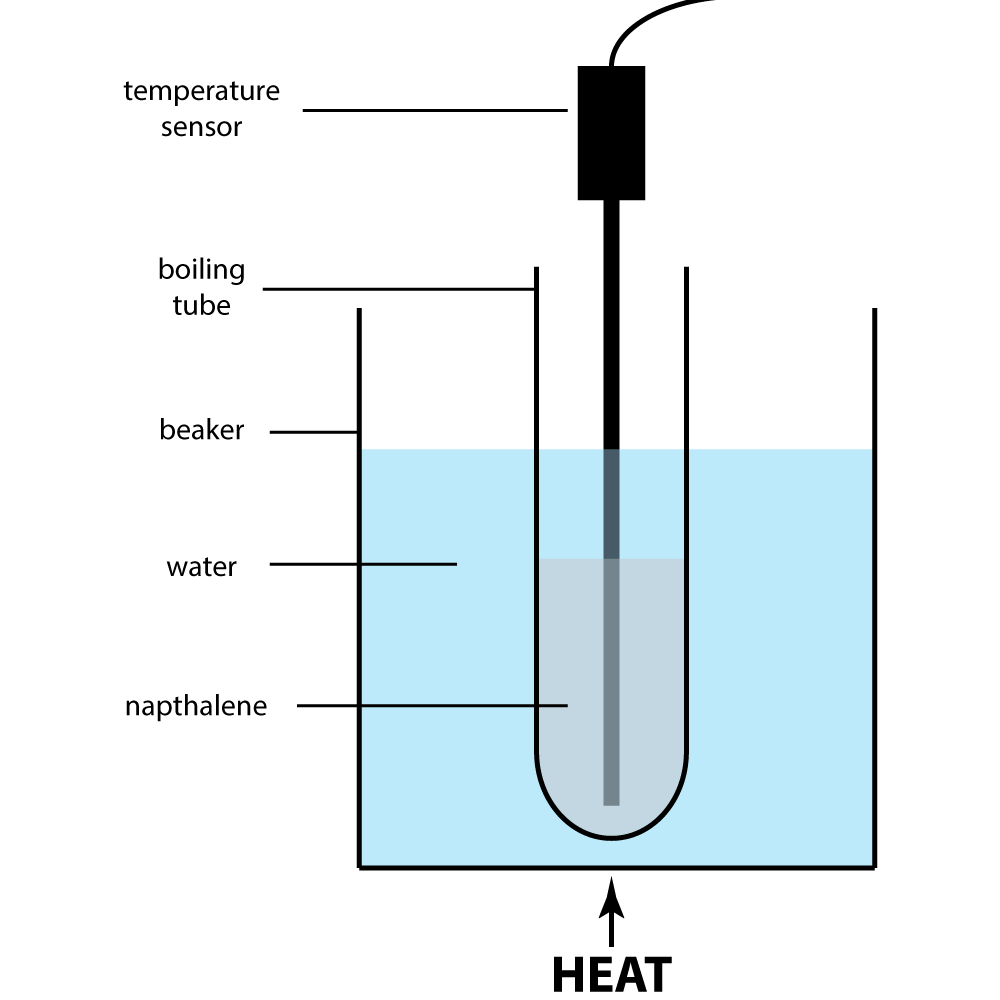
This is a typical investigation into this constant temperature change as shown in figure 2:
You will need:
Method
Place the boiling tube containing naphthalene in the beaker of cold water as shown in figure 6. Heat the water until the naphthalene has melted and has reached 90 0C or above. Then put the temperature sensor in the liquid naphthalene as shown, turn off the heat source and begin recording the temperature.
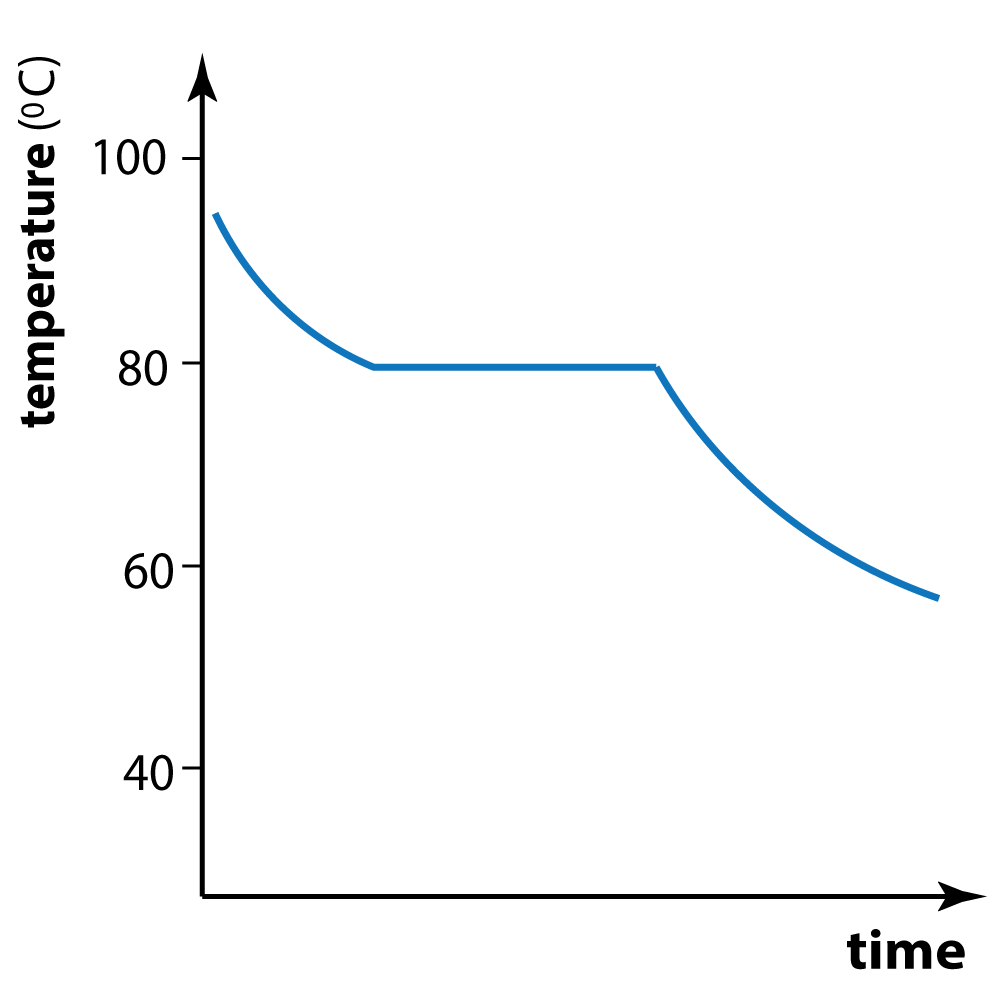
As the naphthalene cools and freezes again, you should be able to see a flat region in the graph, just like in figure 2 above. However, this time the temperature is falling as it cools, so the graph is reversed as shown in figure 4.
Note that you could leave the temperature sensor in the frozen naphthalene, and repeat the experiment to obtain a graph with the temperature increasing as it is heated.
You can see from the graph that the freezing (and melting) point of naphthalene is about 80 0C.
Note that the results are ideal, and in practice it can be quite hard to get a completely flat line on the graph - the naphthalene at the edge of the tube cools faster so heat energy is not evenly distributed throughout the substance.
You will need:
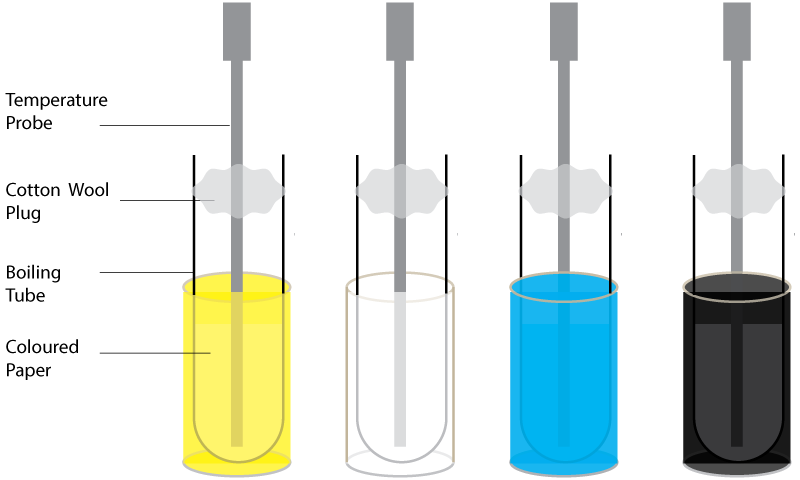
Figure 6. Investigating heat radiation
Method:
Place all of the boiling tubes in direct sunlight, or under desk lamps, so that all are being equally heated by the heat radiation. (For example, make sure the lamps are the same distance from each tube). Record the temperature of the air in each tube at the start of the experiment, and then leave the tubes for 10 to 20 minutes. Then record the increase in temperature in each tube.
Results:
What you will find is that the black tube will heat up quickly, and the white will only increase a little. This is because black surfaces absorb heat radiation, and white and other light colours mostly reflect the radiation. In fact, silver reflects very effectively, just as it does with visible light. Shiny surfaces, even if black, also reflect some radiation. Dull surfaces (also called 'matt' e.g. Matt black) absorb infrared more readily.
Alternative methods:
You could also try metal plates, with wax attached as per the investigation described above for conduction. Each metal plate is painted a different colour, and held a fixed distance from a heater / lamp or similar source of heat radiation. The time it takes for the wax to melt and a pin to drop with give a measurement of how well the coloured plate absorbs radiation.
In this experiment, a cube called a 'Leslie' cube is required. This cube can be filled up with hot water. Each side is of the metal cube is painted a different colour. The outside of the cube shows different temperatures when tested with an infrared temperature sensor as shown in figure 7:
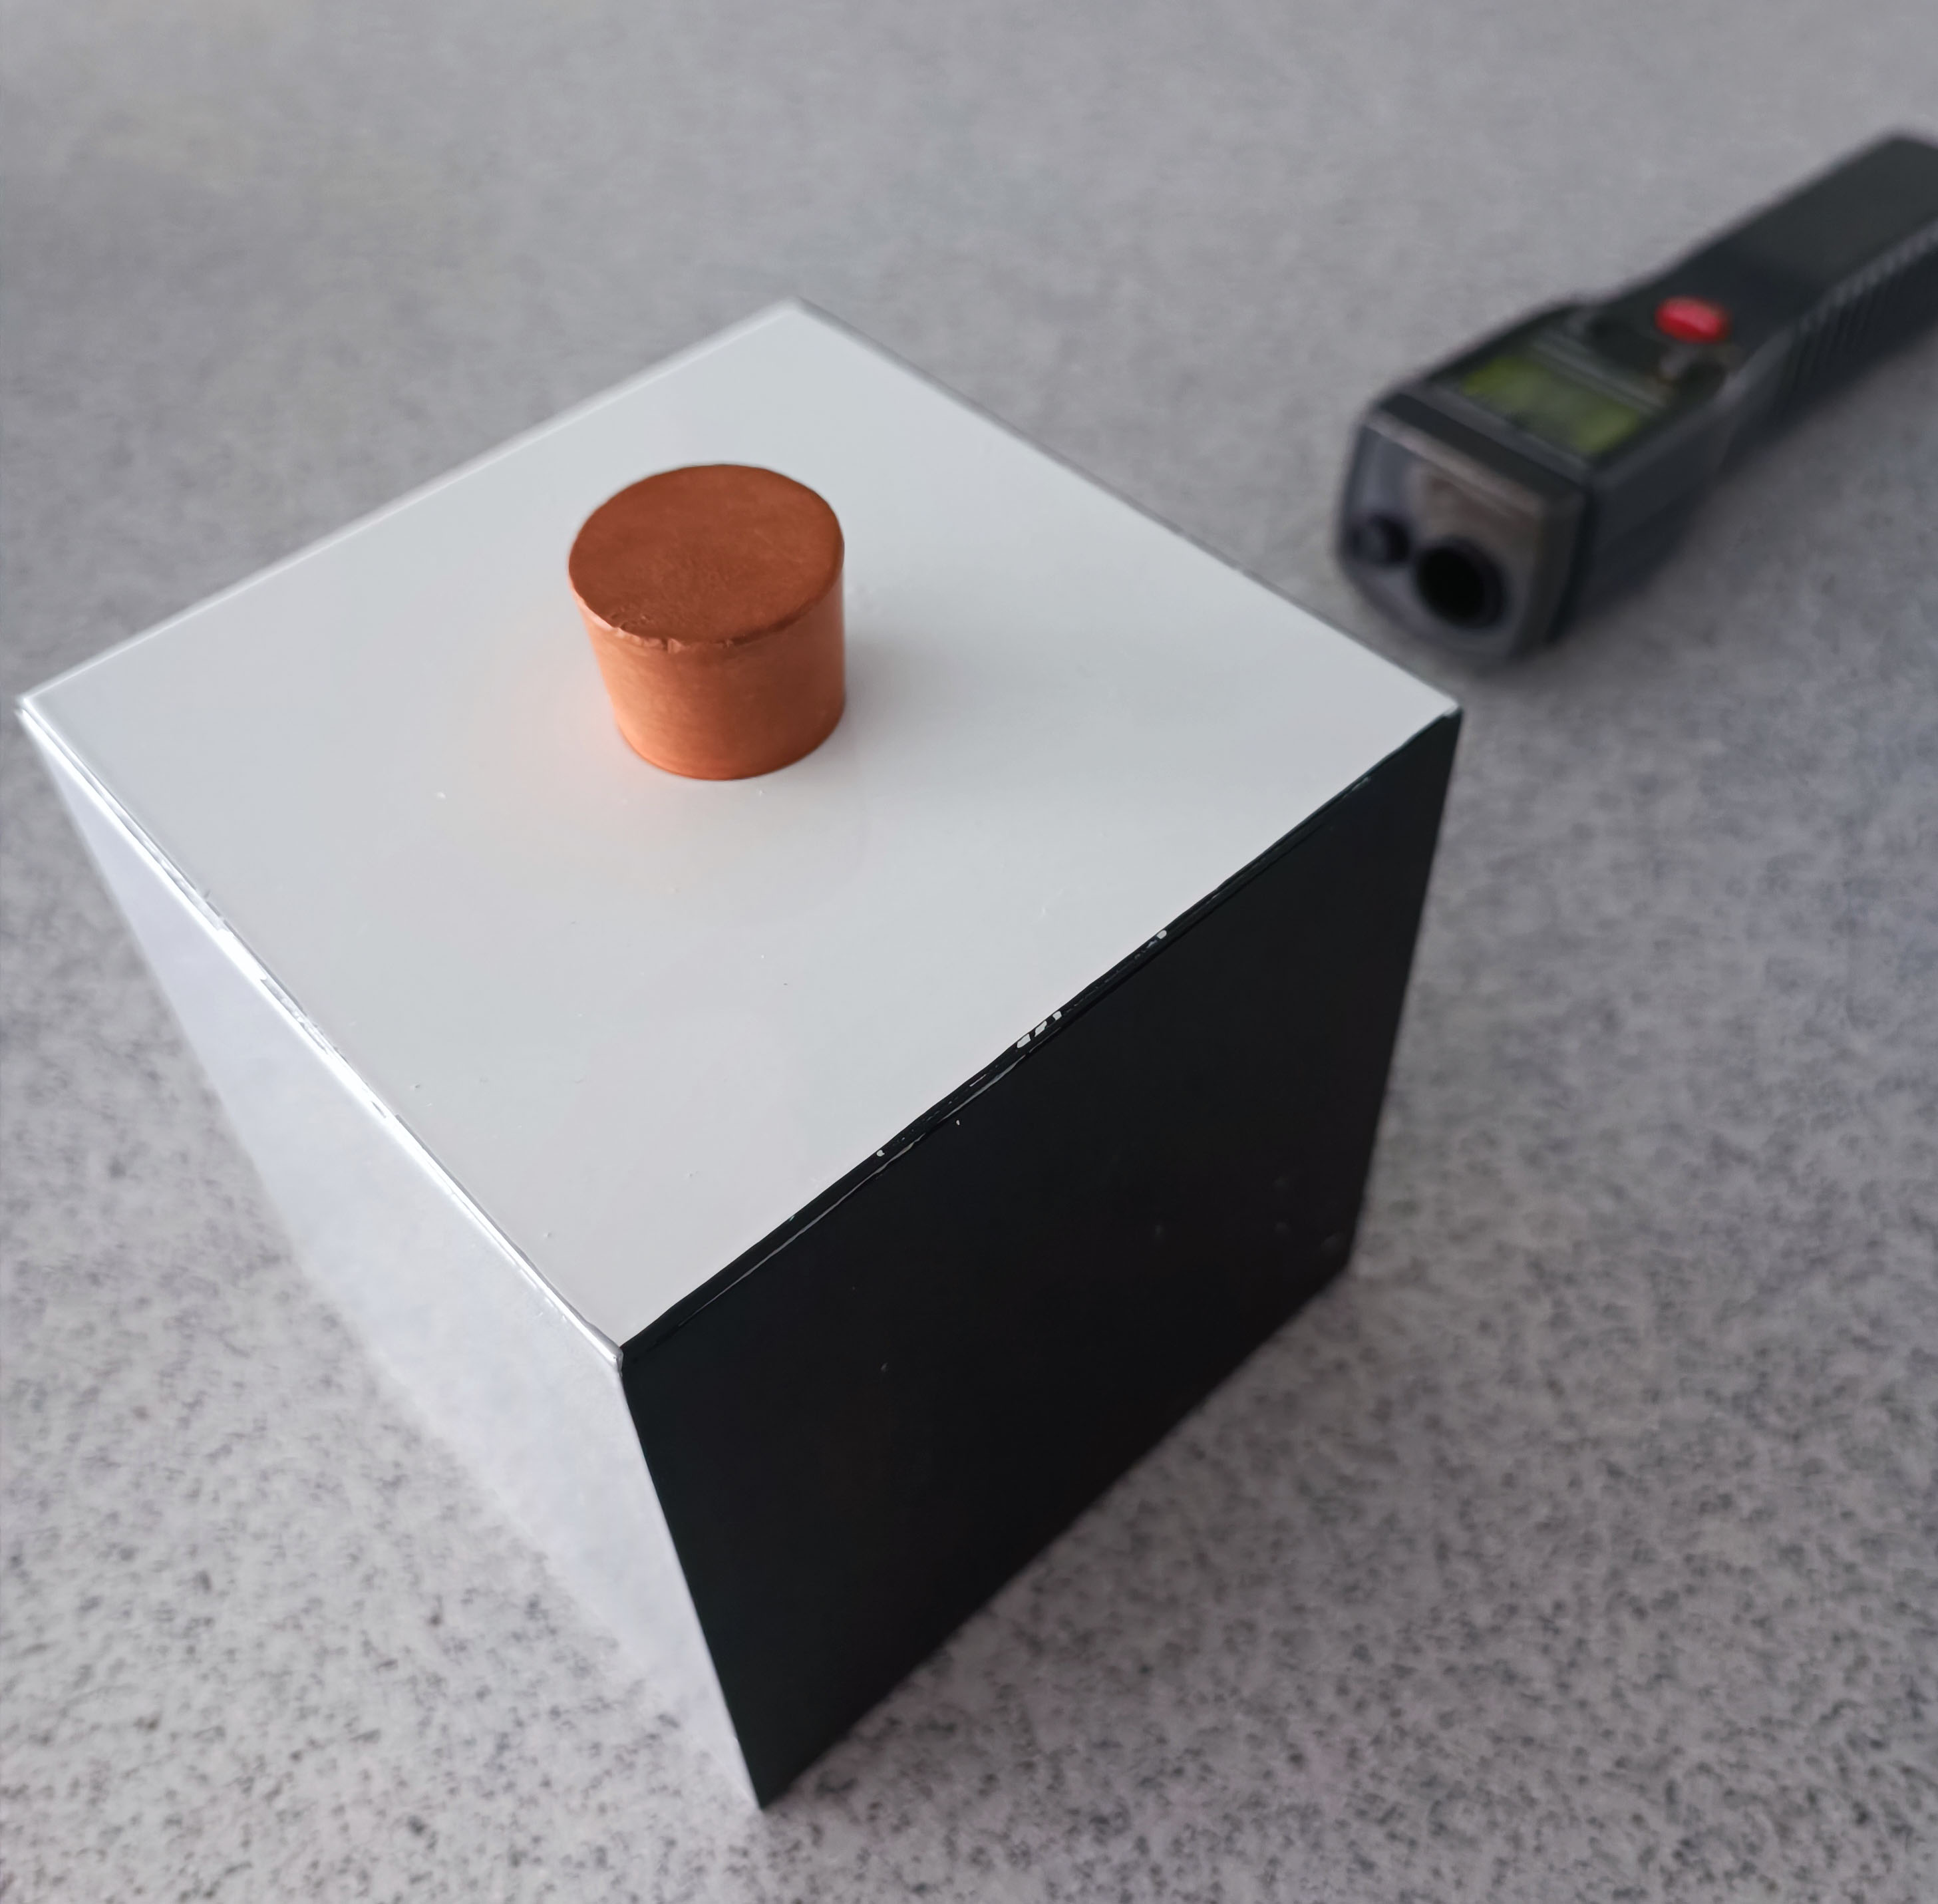
Figure 7. A Leslie cube emitting heat radiation
Results
The matt ('matt' = not shiny) black surface shows the highest temperature, and the shiny silver surface (not shown) has the lowest temperature. This demonstrates that matt black surfaces are the best heat radiation emitters. Shiny surfaces are less effective, and silver surfaces are extremely poor at emitting infra red radiation.
To find the speed of any object, we need to find the time it takes to cover a specific distance. We can use this principle with sound. For this course, you will need to be able to describe an experiment to measure the speed of sound. There are many methods available, but this one is simple to perform if you have a nearby building next to open ground:
You will need:
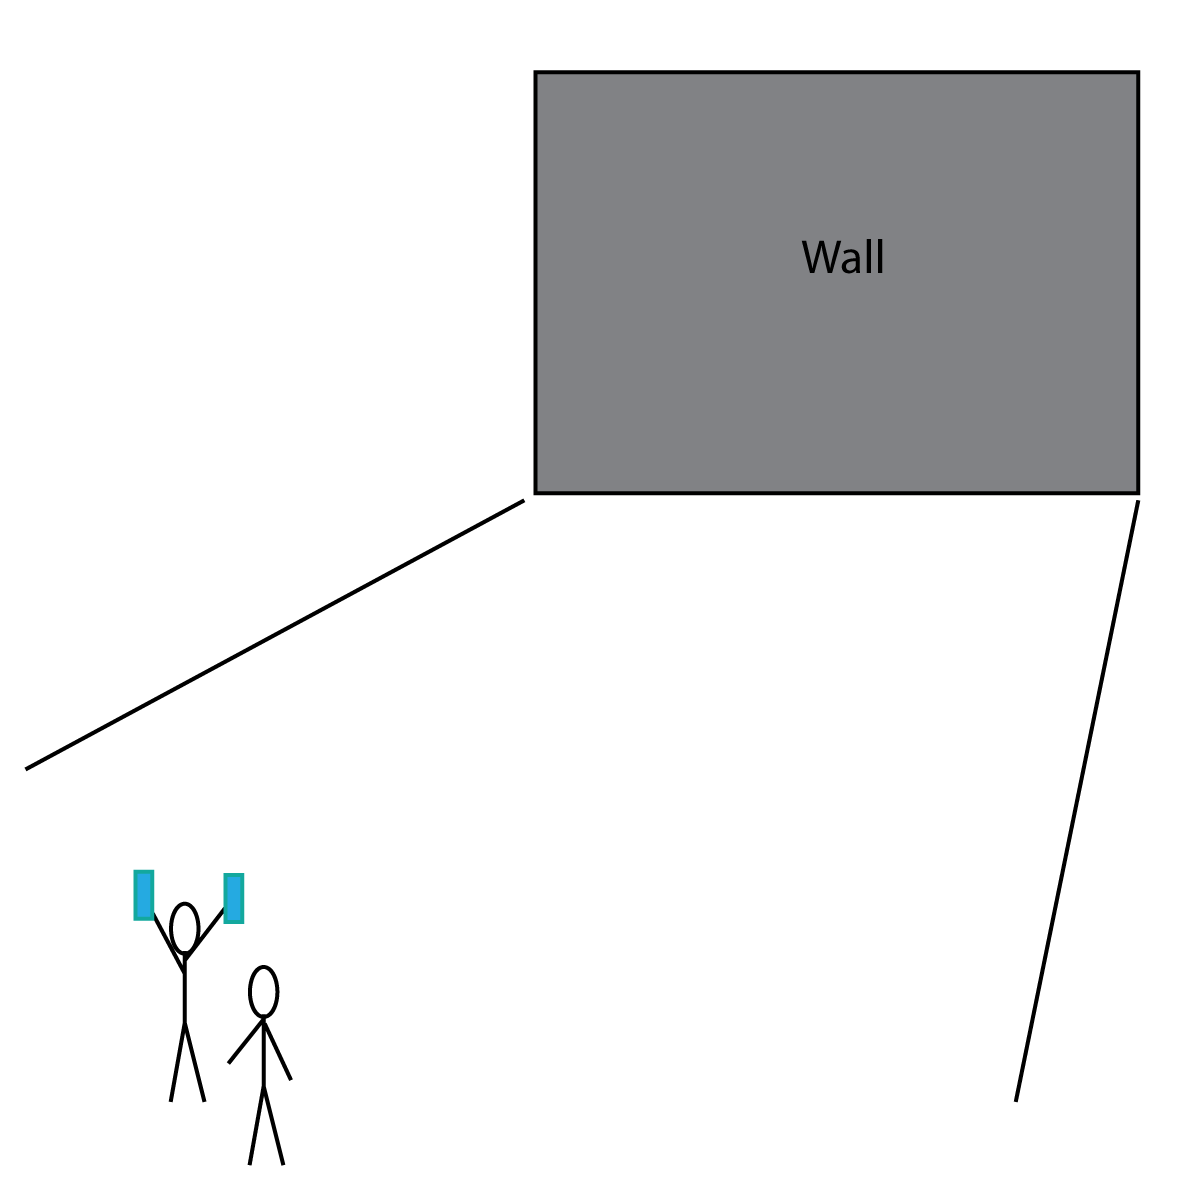
Figure 4. Measuring the speed of sound
To perform this experiment, simply bang the two wooden blocks together at the same time as a partner starts a stop watch. You will hear an echo from the wall - stop the stop watch as soon as you hear the echo. (An echo is a reflection of the sound from the wall).
Do this several times to get an average - it can be difficult to measure this accurately. If you have the distance to the wall, and the time it took for the echo to return to you, then we can use:
| speed = | distance |
| time |
This will give us the speed of sound. Remember that the echo travels there and back, so you will need to double the distance to the wall to find the distance travelled by the sound wave.
Alternative Method:
You could also try this without using an echo. One person ('A') with a stop watch stands a long distance away, typically 300-500 m from person ('B') who is going to bang wooden blocks together as described above. This time, person A starts the stop watch when they see the blocks being banged together, and stops the stop watch when they hear the sound less than a second later. Light travels much faster than sound, almost instantaneously in this experiment, so the delay is due to the slower speed of sound. If the distance is known as well as the time taken for the sound to travel from B to A, the speed can be calculated.
You should know that the expected value for the speed of sound is about 330 to 350 m/s, and the exact value depends on various factors such as air pressure and temperature.
We can investigate resistance by measuring the current flow for different voltages. To change the voltage, it is easier to use a variable power supply instead of changing the cell or battery each time. (See figure 2). We use an ammeter and voltmeter as described in section 2.2. Here is the circuit needed:

Figure 2. Investigating the properties of a resistor
As the voltage increases, it forces more current through the resistor, but the size of the current stills depends on the resistor as shown below:
The table shown here gives some typical (but simplified) results:
| Voltage (Volts) | Current (Amps) |
|---|---|
| 0 | 0 |
| 4 | 1 |
| 8 | 2 |
| 12 | 3 |
Table 1. Typical results for a resistor investigation
Conclusion
As can be seen in the investigation above, the higher the voltage, the higher the current. See the next section to find out how to process the results and calculate the resistance in this circuit.
Note: It is possible to do this investigation using a variable resistor to change the p.d. across a fixed resistor that is under investigation. You will learn more about variable resistors in this section.