
You will need to be able to describe an investigation to find the S.H.C. of materials, usally a solid. Typically, aluminium or copper is used in a simple experiment:
You will need:
Method:
Set up the apparatus as shown in figure 2. Before the power pack is switched on, measure the temperature of the block if using a thermometer instead of a sensor and data logger. Then turn on the power supply.
The joulemeter will begin recording the energy in joules being transferred to the heating element, which we assume to be 100% efficient. When the temperature of the block has increased significantly, say 40 or 50 0C, turn off the power pack. Leave the apparatus for a short while as the temperature may increase further as the heat conducts through the metal. Then record the energy transferred and the temperature rise.
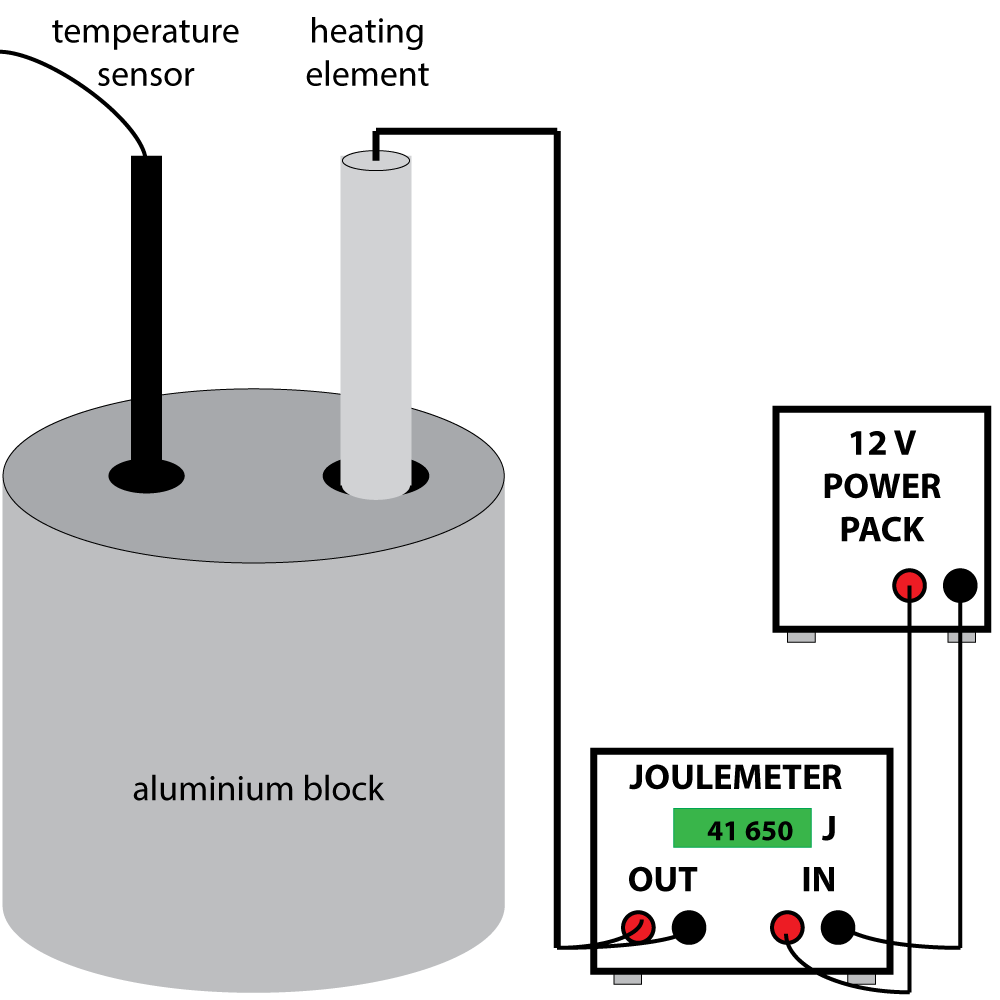
For best results, insulate the block to prevent heat loss to the surroundings. (Not shown in the diagram). A drop or two of water in the temperature sensor hole will lead to better contact between the sensor/ thermometer and he block.
Results:
We can find the S.H.C. of the copper/aluminium by substituting our results into the rearranged formula above:
| c = | ΔQ |
| m x ΔT |
To find the S.H.C. of water (or similar liquid), just use a known mass of water in a thin light beaker. Repeat the experiment above with the sensor and heating element in the water, and stir regularly to ensure the heat energy is distributed evenly. Some heat energy will transfer to the beaker, but if it has a low mass compared to the water it should not have a significant effect on the result.
Investigate the effectiveness of different materials as thermal insulators, and the factors that may affect the thermal insulation properties of a material.
In this practical, we need to make a model of something warm like a model house, and then test how well insulators keep the model warm. The simplest model is just a cup with a lid, for example a beaker covered in cling film or a coffee cup with a lid. The cup is filled with hot water. The lid is needed to stop the water evaporating or heat loss by convection.
Method
Set up two coffee cups as shown in the diagram below. Fill both with hot water and begin taking readings of the temperature as the two cups cool down. Here, a temperature sensor is used, connected to a datalogger to record the temperature.
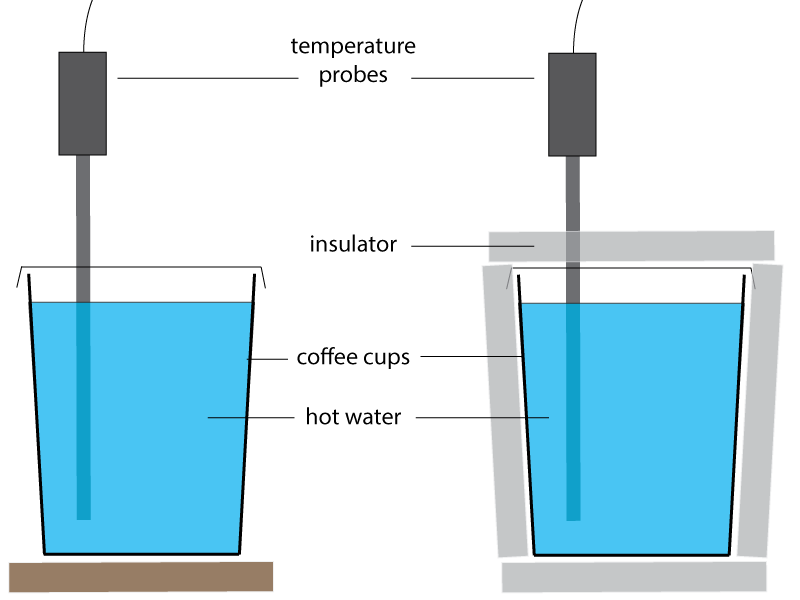
If a thermometer is used rather than a temperature sensor, take a reading every 1 minute for about 25 minutes. The readings can then be plotted on a graph to compare the rate of cooling.
Typical results
As can be seen from the graph below, the beaker with no insulation cools faster than the insulated beaker. This method can be used to compare different insulators, or the thickness of insulator used.
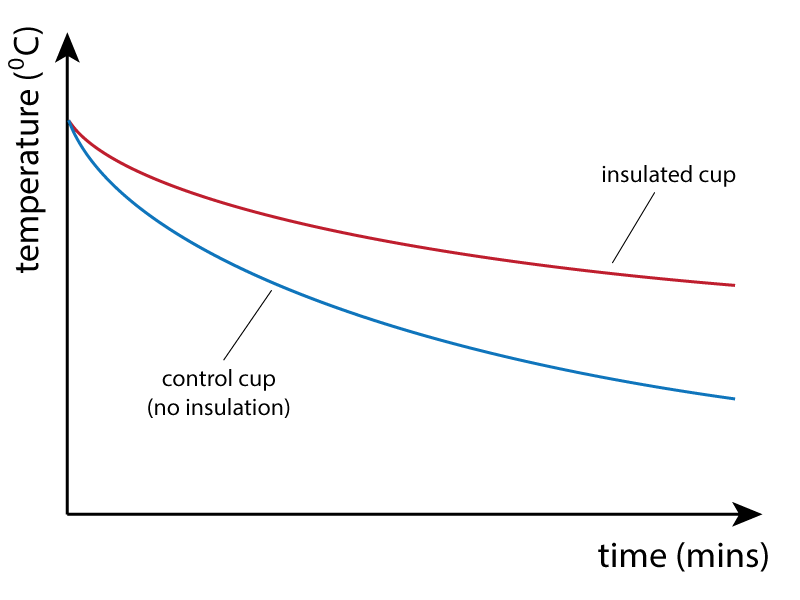
Note that the cup with NO insulation is used as a control experiment, so that results with any insulator can be compared against a standard result for no insulation. The description above is the basic procedure. For a wider full investigation, the control experiment could be compared against:
Investigate the factors affecting the resistance of electrical circuits.
In this practical, you need to be able to follow a circuit diagram and set up the circuit needed to complete the following investigations:
The circuit diagram for the wire investigation should look something like this:
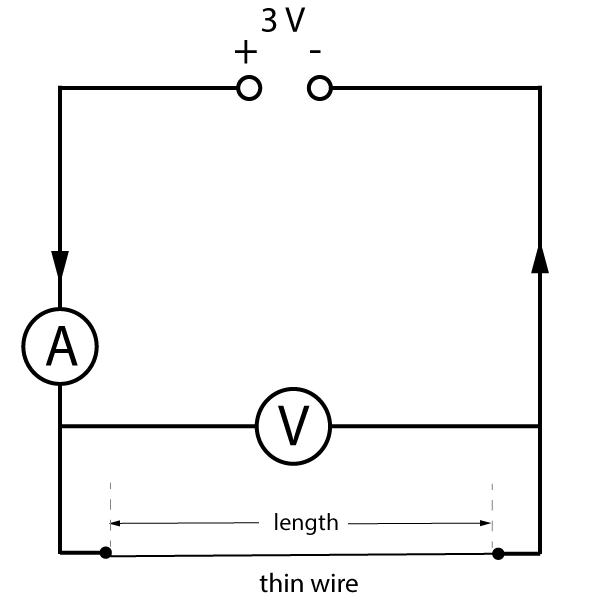
Figure 5. How does the length of a wire affect resistance?
The potential difference across the wire and the current through it can be measured for a range of lengths. The resistance of the wire can then be calculated using the current and voltage readings.
Notes:
The wire in this experiment could be replaced with a network of resistors to investigate how connecting them in series or parallel affects the total resistance of the circuit.
Investigating the I-V characteristics of components.
In this practical, you need to be able to follow a circuit diagram and set up the circuit needed to measure the current and potential difference across resistors, diodes and filament lamps. You can then use your results to produce the familiar I-V characteristics as shown in the graphs at the bottom of this description.
A typical circuit will look like this:

Starting with the power supply set at zero volts output, increase the voltage up to a maximum of 12 V, usually in 1 V steps. Note that many power packs have really unreliable outputs - you should use the readings on the voltmeter, not the setting on the power pack!
After recording these readings, you can reverse the power pack connections
to generate negative values, and then plot a graph to show the full I-V characteristics as shown in the resistor graph below.
Expected Results:
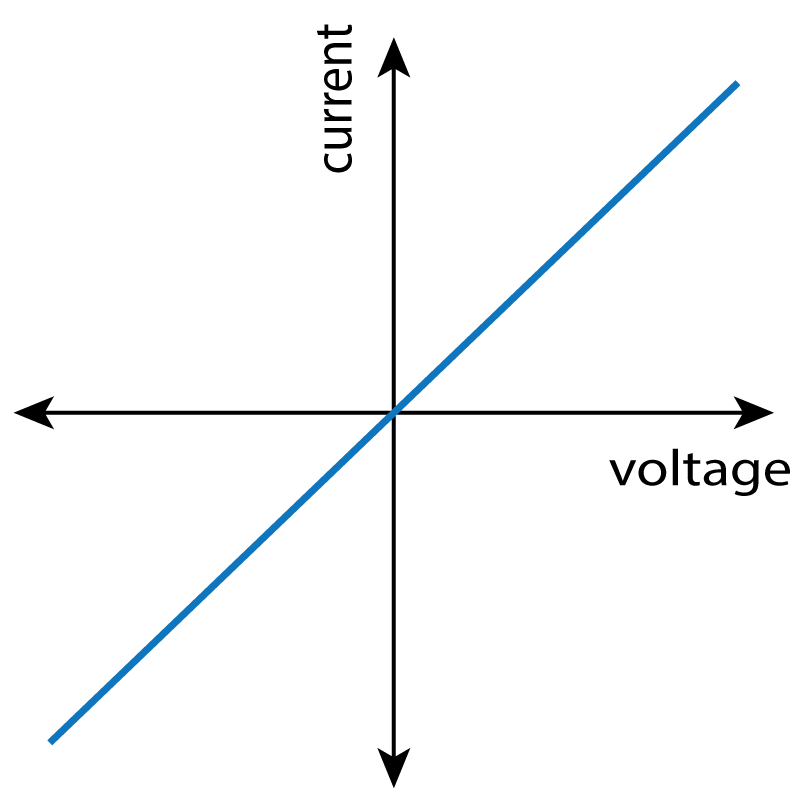 |
 |
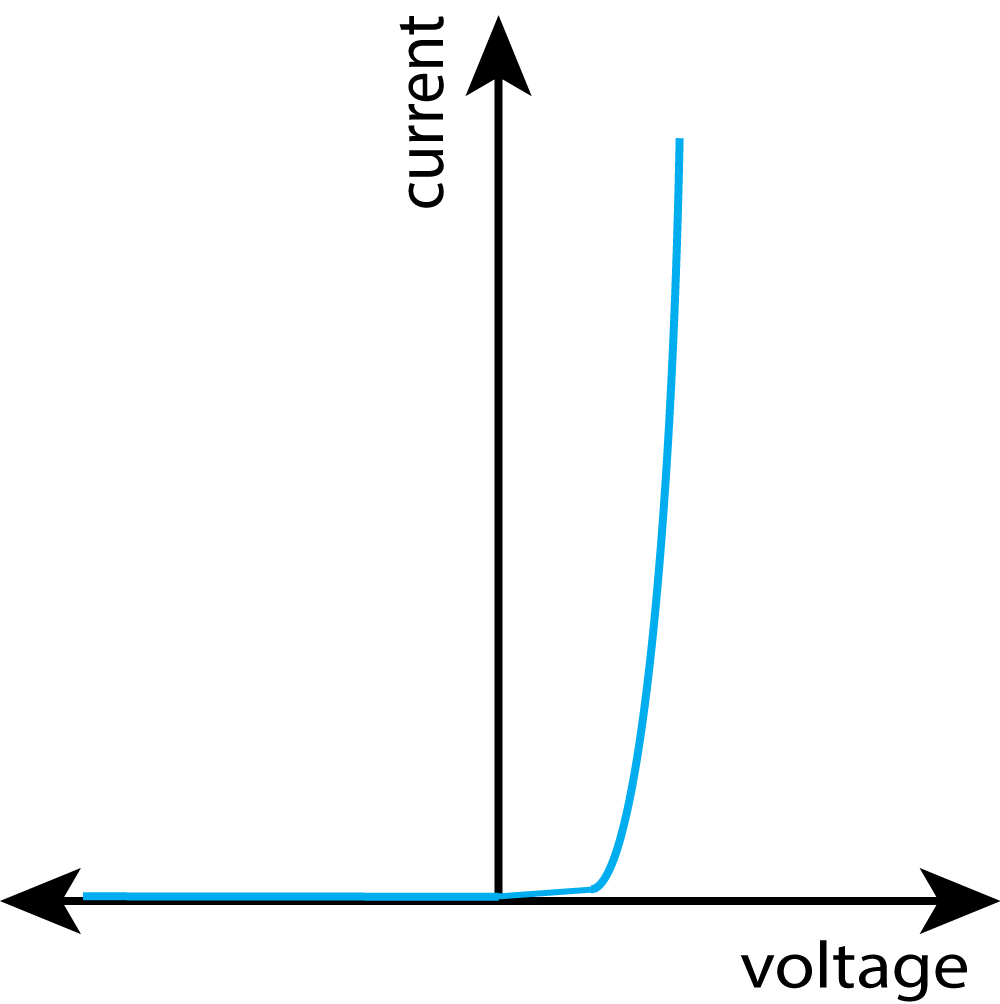 |
| Resistor | Bulb / Lamp | Diode |
You will need to know how to carry out a practical to find the density of an unknown substance. To do this, you will need to do the following:
There are several standard ways to find the volume of a solid or liquid:
If the substance is a regular block with a rectangular cross section, then finding the volume is relatively easy:
For liquids, the volume can be found using a measuring cylinder. The volume of a liquid is typically measured in millilitres (ml), but a millilitre is the same volume as a cm3.
For irregular solids, for example a small stone, you will need a specialist piece of science apparatus called a eureka can, as shown in figure2:
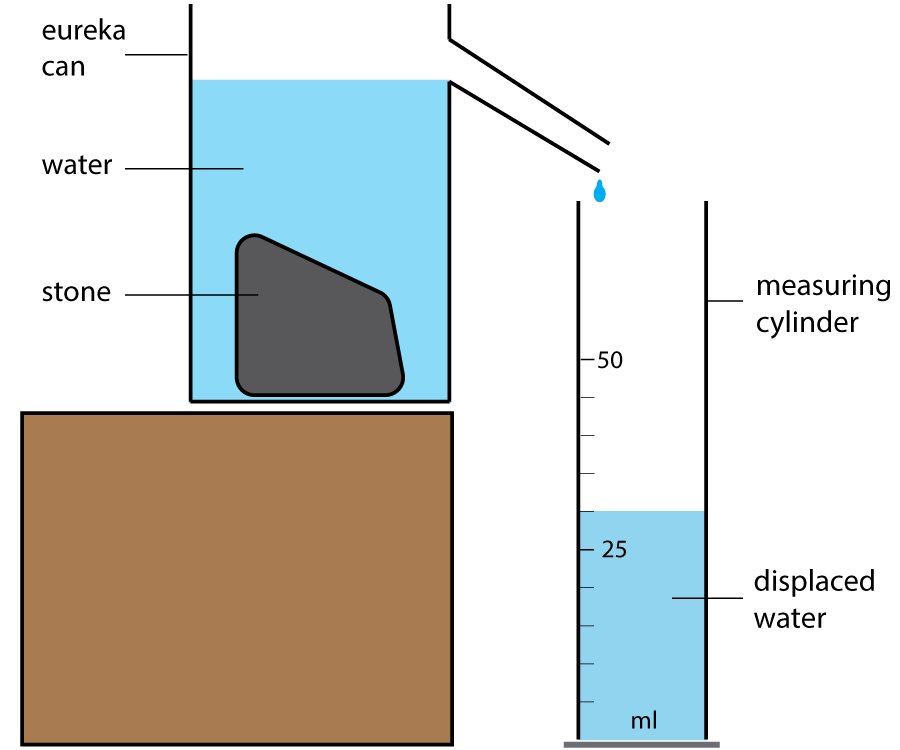
Figure 2. Using a eureka can to find the volume of a stone
The can is filled with water until it leaks out of the spout at the side. Once the leaking has stopped, put an empty measuring cylinder under the spout and then place the stone in the can. The stone will displace water - effectively pushing it out of the way, and this displaced water can be collected in the measuring cylinder. The volume of the water collected is the same as the volume of the stone.
Note:
For measuring small dimensions, such as finding the diameter of a wire, a ruler is impractical. You will need to use either a vernier caliper, or more likely a digital caliper or micrometer as shown here:
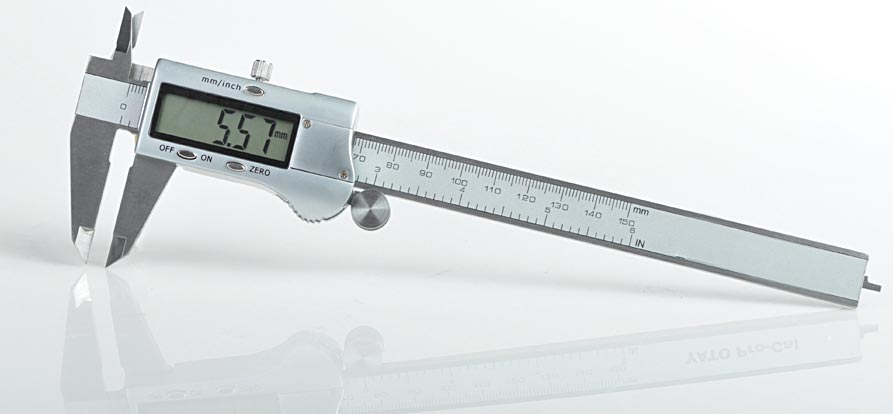
Figure 3. A digital caliper
Lior Streng (edited) | CC 4.0
The basic principle, or 'law' on how cables and springs stretch is best understood by carrying out a practical investigation. (This was first done by a scientist called Rober Hooke, and is usually referred to as Hooke's Law). This is a standard practical that you should know how to perform :
Investigate the effect of varying the force on the acceleration of an object of constant mass, and the effect of varying the mass of an object on the acceleration produced by a constant force.
a) In this required practical, we are going to measure the acceleration of a toy car or trolley on a flat surface, typically a lab bench. We are going to use some weights (masses) to provide a force. We can time how quickly the car moves between 20 cm sections marked on the desk as shown here:

Figure 4: Investigating force, mass and acceleration
The speed of the car can be found for the first and last 20 cm sections. (Speed = distance ÷ time). We also need to know the time taken to move between these sections. We then have the change in speed, and the time taken. Then we can use the Newton's 2nd law formula above to find the acceleration of the car.
This is a bit complicated involving several measurements, and could be simplified if we find the acceleration in one go with the use of light gates.
Now we know the acceleration, we can see what effect the applied force and mass has on this acceleration. We can:
What will we find out?
The expected results are as per Newton's 2nd Law above:
Make observations to identify the suitability of apparatus to measure the frequency, wavelength and speed of waves in a ripple tank and waves in a solid and take appropriate measurements.
a) In this required practical, we first need to use a ripple tank to see waves in water. The video below explains how a ripple tank works and how it can be used to measure wavelength.
YouTube video - Waves in a ripple tank - Open University.
The speed of the waves can be measured directly by observing and timing the waves on the water surface travelling a set distance. Once you have measured the wavelength and the wave speed, you can use the formula v=ƒλ to calculate the frequency.
Top Tip: Use a digital camera / phone to take a slow motion video, with a ruler in view. That way you can see the wavelength and calculate the speed from data from the image.
b) Another part of this required practical is measuring waves through solids, the best example of which is a wave on a string or wire, as shown here. These are actually 'standing waves', caused by reflections, but we do not need to understand exactly how they work to see the waves clearly:
YouTube video - Waves on a string - Quantum Boffin.
In this experiment, the teacher is changing the frequency of the signal generator on the left (which is vibrating the string), and taking a reading of the frequency from the screen. The wavelength can be measured easily with a ruler. (Not shown here). However, take care, as each wave segment is actually only half a wave, from the mid point to a peak and then back again. The motion is too fast to see this clearly. Measure the length of 2 wave segments here to find the full wavelength.
Notice that as the teacher increases the frequency, the wavelength is decreasing each time.
Once you have the frequency from the generator, and the wavelength by direct measurement, you can then calculate the wave speed using the formula v=ƒλ.
Investigate the reflection of light by different types of surface and the refraction of light by different substances.
For this topic, you will need to be able to describe an experiment to measure the reflected and refracted rays produced by various substances, typically rectangular blocks of glass, perspex and other plastics. The theory of these is covered above, but you should know how to carry out this investigation. Typically, you will need:
Method:
Set up the ray box with a narrow slit opening so that a thin beam of light is produced. Direct the beam at an angle to a rectangular block as shown here. Draw round the block so that the outline can be seen. Use a pencil to mark where the reflected and refracted rays are observed, and then complete the diagram to show where the rays of light have been reflected or refracted. it should look something like this:
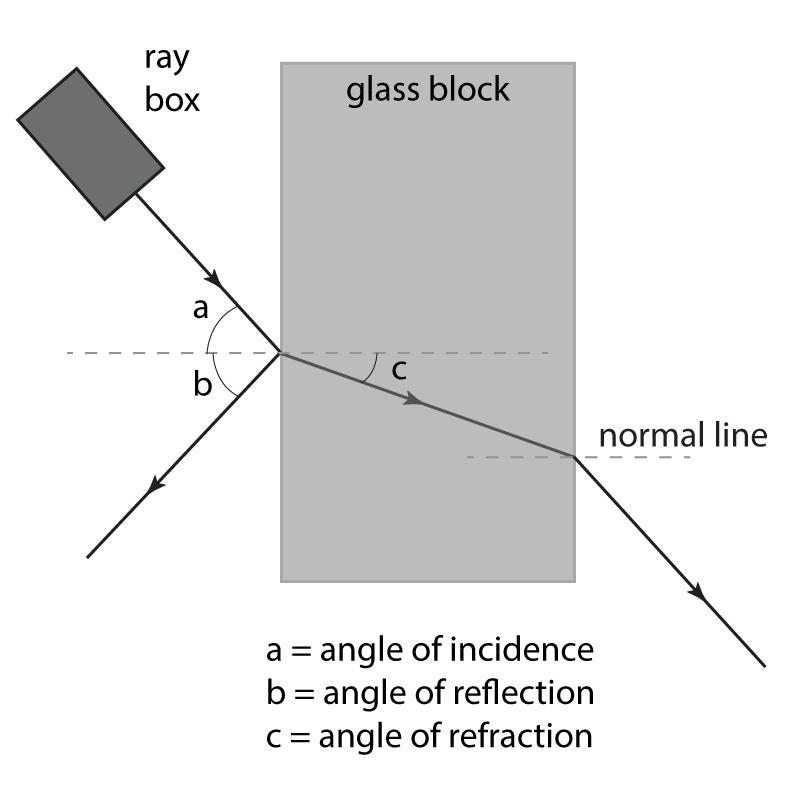
As shown on this diagram, the angles of incidence, reflection and refraction can be measured. The experiment can then be repeated using different material blocks to see how this affects the angles.
Alternatively, semi-circular blocks could be used as shown in figure 5 above, or this excellent 'PhET' simulation - click the image to take you to this on-line experiment:
PhET simulation: Bending Light
(external site link: University of Colarado)
Investigate how the amount of infrared radiation absorbed or radiated by a surface depends on the nature of that surface.
a) Radiated infrared:
For this practical, you will need an infrared radiation detector of some sort (see below) and a range of different hot surfaces. One classic piece of apparatus is called a Leslie cube, which is basically an empty metal cube, with a lid so that you can add really hot water. Each side of the cube is painted a different colour, typically black, white, silver, grey etc. Once filled with hot water, a detector can be used to measure the levels of infrared being emitted by the surfaces. Which colour would you expect to be the best emitter of infrared radiation?
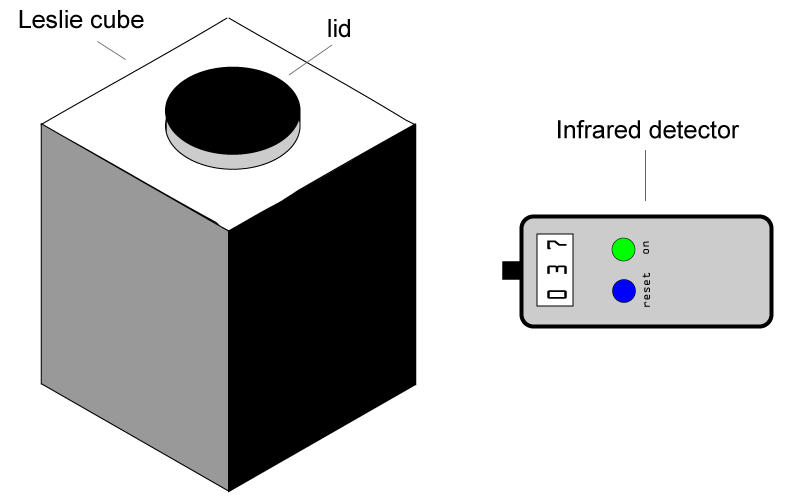
There are many forms of detectors available, and one can be made using a simple microprocessor kit like the BBC microbit or Arduino. Alternatively, a blackened thermometer will absorb the infrared and heat up. The more infrared emitted, the higher the temperature shown. The thermometer will need to be quite close to the surface of the cube.
b) Absorbed infrared:
Try painting thermometers (or cheap heat sensors) with black , grey, white or other coloured paint, and repeat the experiment above. This time only use the black face of the cube, which is the best emitter. Alternatively, you could use a commercially available low voltage electric heating element - one that glows red to show it is hot! In this experiment, the black surface on the thermometer clearly absorbs more infrared radiation and the thermometer gets hotter than the others.