Physics
Cambridge IGCSE
There are several easy ways of picking up extra marks in the exams with some basic knowledge of how marks are awarded. These techniques are easy to learn:
There are some easy, standard methods for picking up marks on questions involving the use of a formula. To understand these, let's have a look at a typical question:
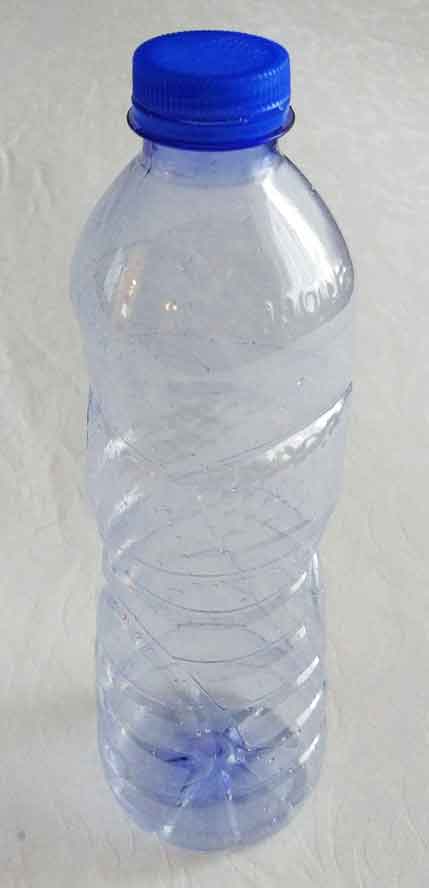
Q1. A gas is contained inside a sealed plastic bottle.
The bottle is squeezed so that the gas is compressed and its volume reduces at constant temperature.
Before being compressed, the gas pressure is 100 kPa and has a volume of the gas is 330 cm3.
After compression, the volume of the gas is 200 cm3.
Calculate the pressure of the gas after compression.
First, here is the full solution to this problem.
We need a formula involving the volume and pressure of a gas at constant pressure. This is already provided in the exam, on the inside of the front cover. It is:
P1 x V1 = P2 x V2
We know from the question that:
Putting all these numbers into the formula gives:
a) 100 000 x 330 = P2 x 200 [ 1 mark ]
b) Rearranging the formula gives:
| P2 = | 100 000 x 330 |
| 200 |
[1 mark]
c) Therefore P2 = 165 000 Pa (165 kPa) [1 mark]
[TOTAL: 3 marks]
Notice how this has been divided into three parts, each awarded one mark. There is no mark for choosing the correct formula, although if you get it wrong, you will get no marks at all!
It is really important that you have learnt all the formulas you need and recognise those provided for you.
Here are two other answers provided by students. How many marks would each one get?
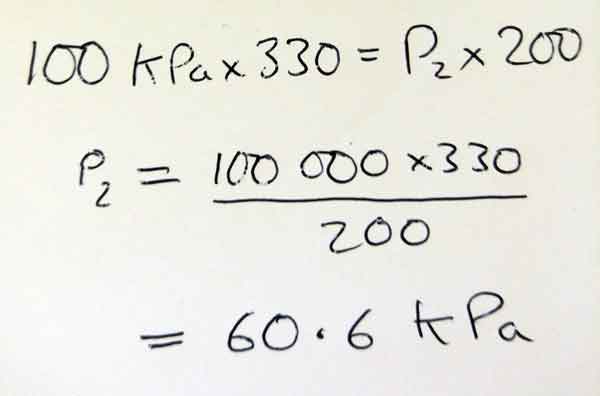
Answer X:
Answer Y:
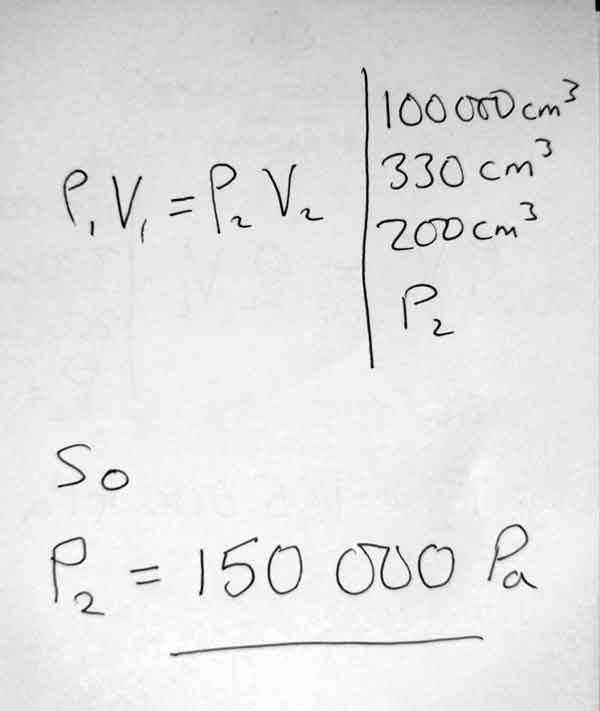
Both answers are wrong! However, answer X would score 2 marks, and answer Y would score zero!
Why is this?
Answer X substitutes the numbers correctly into the formula [1 mark].
They then rearrange the formula correctly, showing some maths skills [1 mark].
They lose the final mark as the final calculation is wrong. However 2/3 is not bad - 66% is a good score!
Answer Y shows the correct formula, but this is copied from the exam paper, so no marks here.
They have written down the correct numbers from the question but NOT put them in the correct places in the formula.
They have shown no working out - no re-arranging of the formula - it looks like they went straight for the calculator without showing what they were doing.
The final answer is nearly correct, but we cannot tell what went wrong as there is no working. No marks here.
Graph questions feature on nearly every exam paper. Typically, you will be given details about an experiment, and then a table of results. You will need to plot the results on a graph, and then answer some questions about the experiment. If you are confident drawing graphs, then these are easy questions!
Here is an example:
Q1. A gas is contained inside a sealed gas syringe.
The syringe plunger is pushed so that the gas is compressed and its volume reduces at constant temperature. The pressure is measured with a sensor.
The table shows how the pressure in the syringe varies with volume.
| Volume (cm3) | pressure (kPa) |
| 45 | 111 |
| 40 | 125 |
| 35 | 143 |
| 30 | 207 |
| 25 | 200 |
| 20 | 250 |
a) Plot these results on the grid provided. [5]
b) Identify any anomalous results. Circle these points. [1]
c) Draw a line of best fit for the results. [2]
d) State one control variable in this experiment. [1]
e) Describe the relationship between the volume and pressure in the bottle. [1]
[total 10 marks]
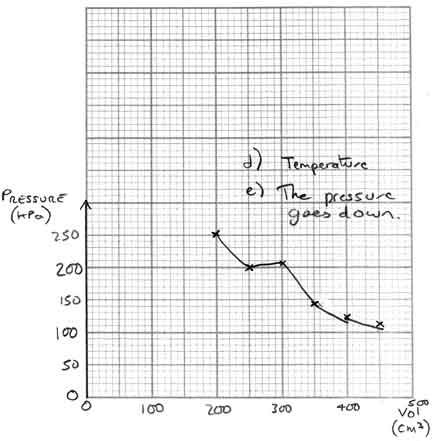
Marks vary from question to question, but plotting the points can take some time. Again, let's look at some typical answers. The answers to (d) and (e) were included on the graphs:
Answer X:
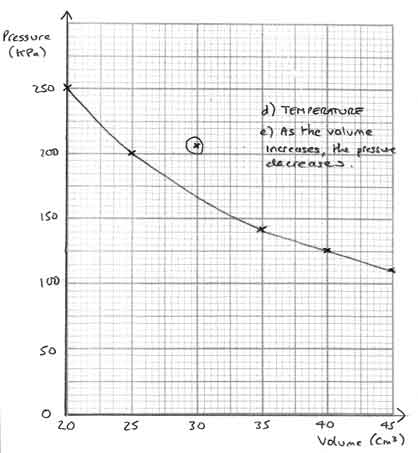
Answer Y:
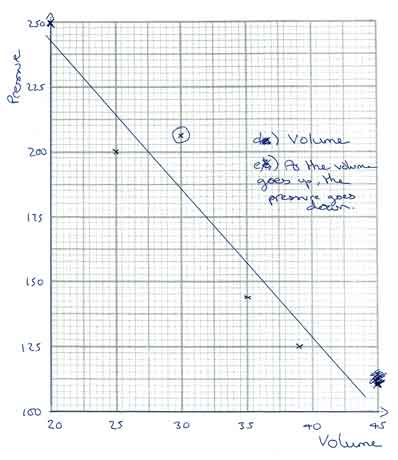
Which do you think is the best graph?
In fact both students have lost marks and scored 5/10, and here is why:
Answer X:
On this graph, the points have all been plotted correctly. However;
Answer Y:
On this graph, the axis are a good size and labelled correctly. However;
If you want to see how the graph should be completed for this question, click here:
[10 marks]